Delving into data: how the pandemic shaped this year
June 14, 2021
After what was surely one of the wonkiest years in Wilson’s history, we couldn’t help but wonder what had changed in our school community. So as any ordinary teenager would, we contacted our school’s trusty Data Coordinator Joseph Bellino to find out.
Not-so-shockingly, the number of online absence notes submitted by parents plummeted this year. In the 2018-19 school year, Wilson’s attendance team received 12,585 online absence notes, compared to the mere 982 notes that have been submitted this year. This means that the average notes submitted per day decreased by 91 percent.
Since daily school attendance has been entirely restructured due to distance learning, it is difficult to pinpoint the exact cause of this change.
Another trend Bellino observed is that, despite lax grading policies, this year’s average term weighted GPA in the first semester was lower than the 2018-19 average. We can only assume that the transition to distance learning had something to do with it.
This year’s average term GPA in the first advisory was 0.16 points lower than that of the 2018-19 school year, however, this gap shrunk in the subsequent advisories; in the second term, there was only a 0.04 point difference between the two years and by Advisory 3, this year’s term GPA was higher by 0.08.
It is plausible then, that as the year progressed, people became more accustomed to learning through a screen, aided by the implementation of a new grading system in the second advisory which made missing work a 50 percent instead of a zero.
Moving onto everyone’s favorite issue: failing classes! Bellino suspects there could potentially be more failing grades issued this year but he emphasized it’s too early to tell. With the distance learning grading policy, students do not receive Fs as their final grade in a course. Instead, they are given an “I” for incomplete and the ability to convert their failing grade to a passing one.
In the first three terms of this school year, 1,206 of the 10,175 courses taken by Wilson students have an I as the final grade, which is 11.8 percent. But Bellino predicts that a significant portion of those will eventually be converted to passing grades, as was the case with 42 percent of them last year.
While we may be failing more classes and are definitely still wallowing in the misery that is Microsoft Teams, it’s comforting to know that, upon our return to the building in the fall, it will be as we always remembered: sweatily congested and delightfully overcrowded. Ah, fond memories.
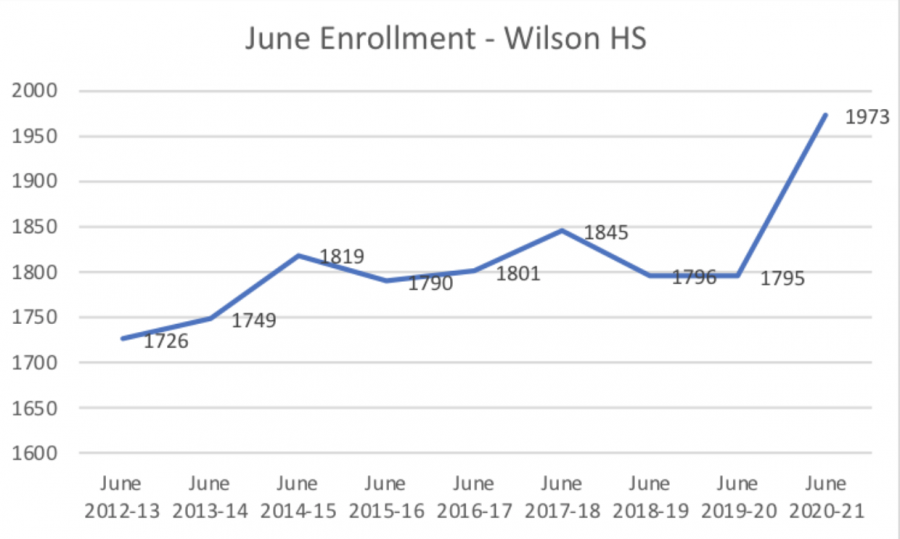
In fact, Wilson may be more crowded than ever before. Bellino found that enrollment as of this June spiked to 1,973 from 1,795 last year. This is the largest increase in enrollment from the years he has data from, starting in 2012-13 and—buckle your seatbelts—approximately 150 percent greater than the next largest jump in enrollment, which was from 2013-14 to 2014-15.
To the six people who are still reading this, congratulations! You’ve made it to the end, you data-loving nerds. We hope you feel enlightened and informed. •