Graph of the month: subject GPA by grade
March 7, 2020

Welcome back, statistics lovers! Bet you didn’t think we’d make it two consecutive months. Lucky for you, we’re too dedicated to the numbers to have given up that easily. And to prove our dedication, we’re here with not one graph, but four juicy, data-packed charts. Data coordinator Joseph Bellino really pulled through with this one! This month, we’re comparing grade point averages between subjects for each class. There’s a lot to unload here, so buckle up while we delve into the numbers.
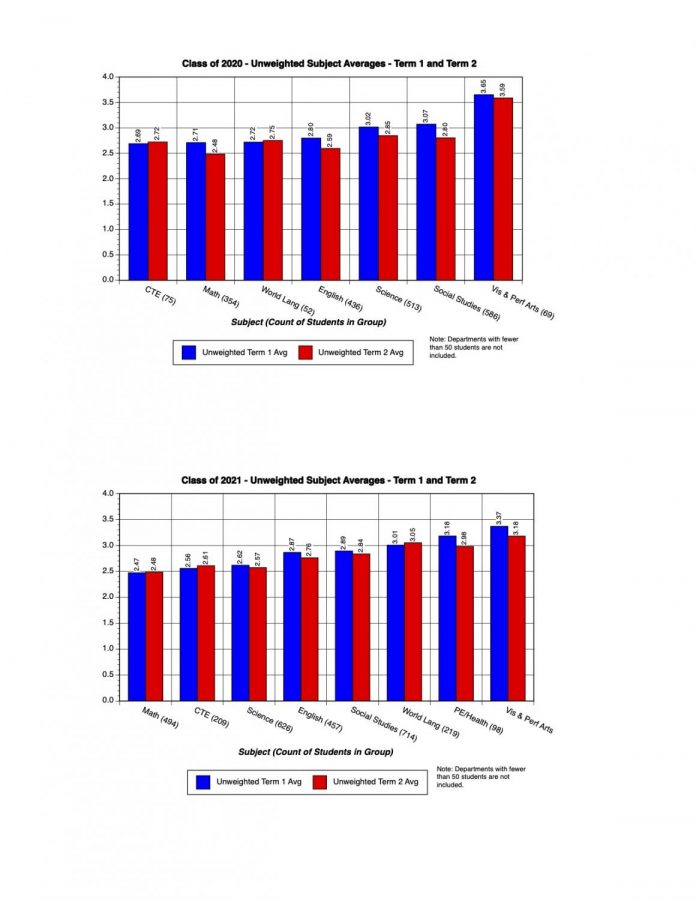
Each chart displays the unweighted GPAs in different subjects for the four grade levels. The left bars represent term one while the right ones represent term two. The subjects are ordered from lowest term one average to highest, and only subjects that at least 50 students take are included.
In most subjects, the averages from term one to term two dropped, which is regarded as an expected trend. Typically after the first term, students lose interest and motivation to continue performing at their highest level. This means the few instances where averages have risen after the first term are a notable anomaly.
The classes of 2021 and 2023 have seen improvement in the most subjects this school year, with the juniors rising in math, career and technical education (CTE), and world language, and the freshmen rising in English, health/PE, and science. The freshmen English trend is particularly significant, rising a whole 0.27 grade points. English teacher Natalie Zuravleff points out that this is likely due to freshmen requiring the first advisory to learn how to deal with the new demands of high school. Another contributing factor could be the absence of reading quizzes in ninth-grade English classes for second quarter, where the curriculum shifted to a focus on study of texts in class. “Those reading check quizzes tend to be a reason their grade suffers in first advisory when they have reading homework and they come in and take a five-point quiz, and if you didn’t read it can really hurt your grade,” Zuravleff said.
Another point of interest, one that Bellino was quick to mention, is how CTE had some of the lowest grade point averages. These courses, such as Computer Applications or Entrepreneurship, are widely thought of as less challenging classes. But their trend of lower grades could indicate that they are in fact rigorous, or at least difficult to attain high grades in.
When tracking individual subjects between grades, perhaps one of the most interesting classes are the world languages. The averages in world language courses become steadily larger from freshmen to juniors. However, the senior world language GPA is by far the lowest. The increase between the first three years could be a result of students dropping language electives after the required two credits, with only those who are genuinely interested in the classes continuing. However by senior year, just 52 students take world languages, many of whom are presumably in AP or higher-level courses.
While the success of each class varied between subjects, there are no glaringly obvious discrepancies over all. The average GPAs were fairly similar, with none of the grades having a clear highest, despite differences in course rigor level, experience, and general motivation. With this lack of major in-your-face trends, we are forced to dig a little deeper into the story that the numbers tell—something that makes our self-proclaimed roles as Official Beacon Data Analysts so much more exciting. We encourage you all to take a few minutes to look at the graphs yourself and discover more trends that make you think.