Graph of the Month: AP enrollment by race
January 30, 2020
Hello loyal readers and data enthusiasts! If you’ve been keeping up with The Beacon lately, it’s likely that you, like us, have noticed a disappointing lack of graphs in our past few issues. We painfully regret having left our readers thirsting for numbers, and for that we apologize. As the Features Editors and fellow statistic lovers, we recognized this drought of data and have taken it upon ourselves to bring back everyone’s favorite column: Graph of the Month.
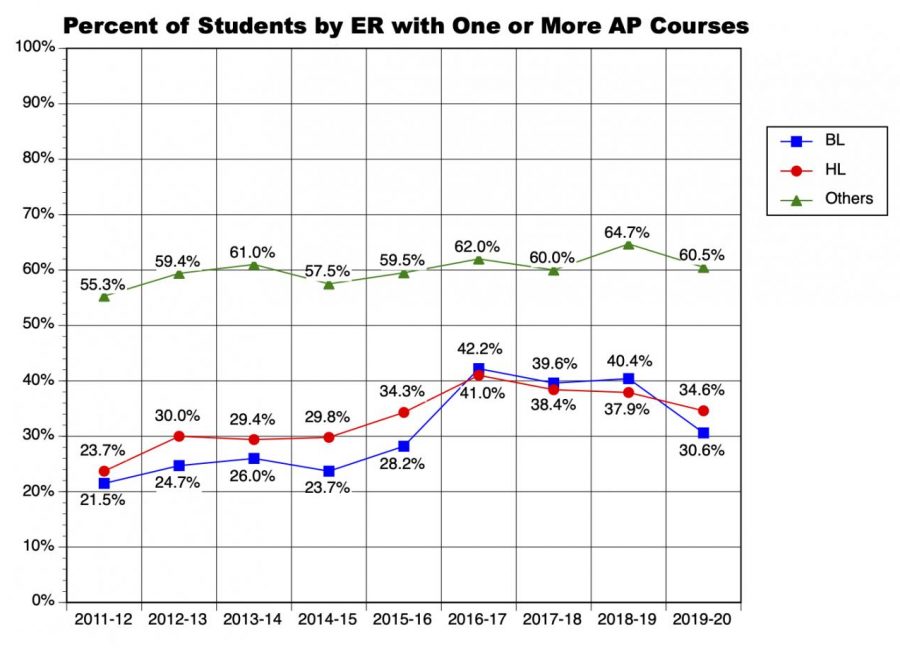
This month’s graph, provided by trusty Data Coordinator Joseph Bellino, displays the percentages of students taking one or more AP classes of different ethnic and racial backgrounds since 2011. The squares represent Black students, the circles are for Hispanic or Latinx students, and the triangles are all others (muli-ethnic, white, and Asian).
What immediately jumps out about this graph is the severe disparity between Black and Hispanic/Latinx students and those of other racial and ethnic backgrounds. This concerning, yet unsurprising display of the achievement gap highlights the severe imbalance of students of color in AP classes at Wilson.
The achievement gap is a complex, systemic problem, and one graph certainly does not tell the whole story. While we must be careful not to make any assumptions in our analysis of the presented data, there are certainly some notable trends that deserve our attention.
One of the most prominent features of this graph is in 2016, when the percentage of Black students taking AP classes jumped by nearly 15 percent. While this could be because of a number of factors, Bellino highlighted the institution of the Minorities in AP (MAP) program, which hosted monthly meetings with students of color who were in AP courses and those who were not. The program was established during Principal Kimberly Martin’s first year at Wilson, during which she made an effort “to try and understand the problem holistically and to provide supports [for] students who needed it,” Martin said. However, MAP was run by teachers working outside of their normal hours, and it slowly died out in the following years.
A more recent trend in the graph is the drop in students taking AP courses in 2019. Despite having the most classes that have been a part of Honors for All, a program started in 2017 to encourage enrollment in rigorous courses, the 2019-2020 school year saw the sharpest total decrease in AP enrollment of the data presented. While the decrease was greatest for Black students at 10 percent, it is important to note that this trend was common among all groups. Martin pointed out that this could be a result of a push to have students rethink taking unhealthy numbers of AP courses. “I think counselors are now doing a better job of coaching kids around, ‘Do you really need that sixth AP class?’” Martin said.
Still, the gap between Black, Hispanic, and Latinx and other students is glaringly large. Martin hopes that when students see this graph they consider the obstacles students of color face as minorities in AP classes. “Students continue to talk about what a challenge it is to be the only student of color or be one of three in an AP class,” Martin said, adding that others should take a second to put themselves in the shoes of those who face these challenges. She hopes this empathy will help students color feel more welcome in AP classes.